The 2024 general election, in which the Labour party secured a 174 seat majority with just 34 per cent of the popular vote, has boosted interest in different electoral systems. Famously, our British First Past The Post (FPTP) system is shunned by almost all of our European neighbours (with Belarus as the one exception). But what are the options, if we were to look for a fairer way to elect our government?
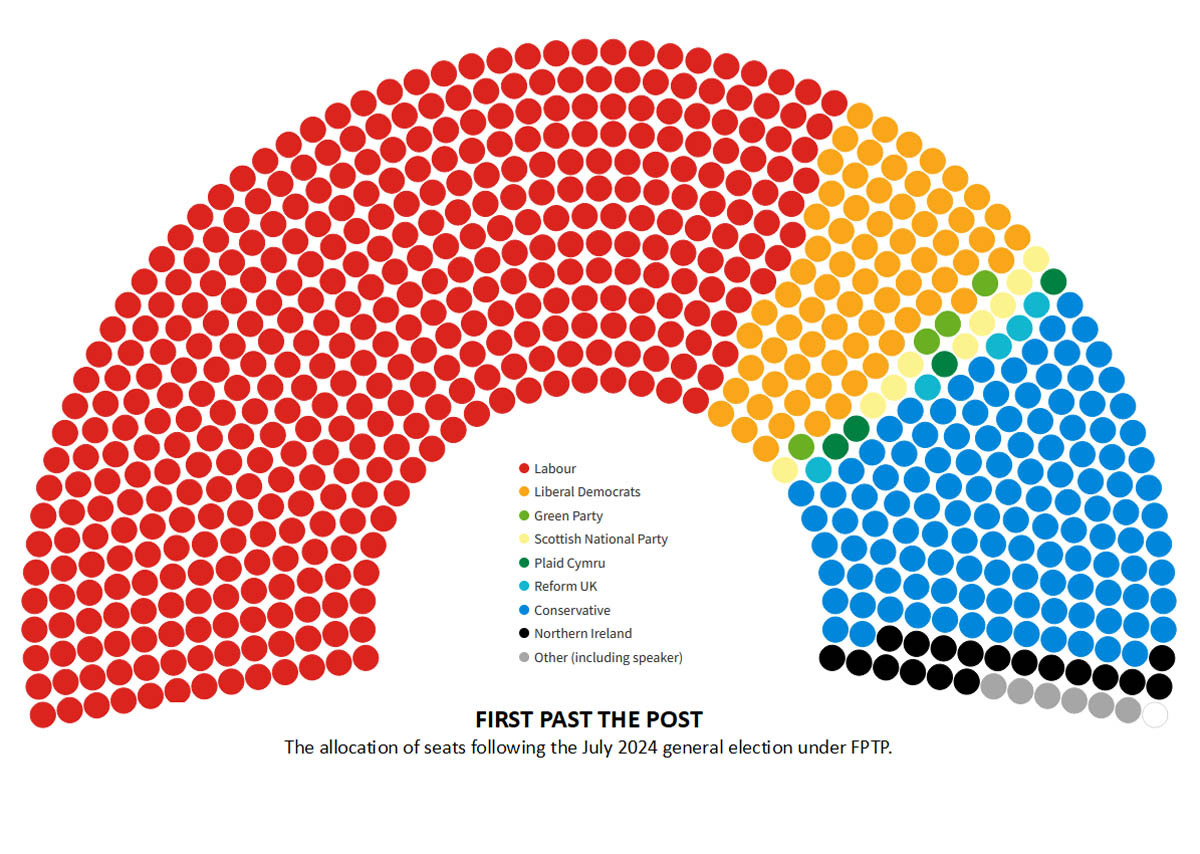
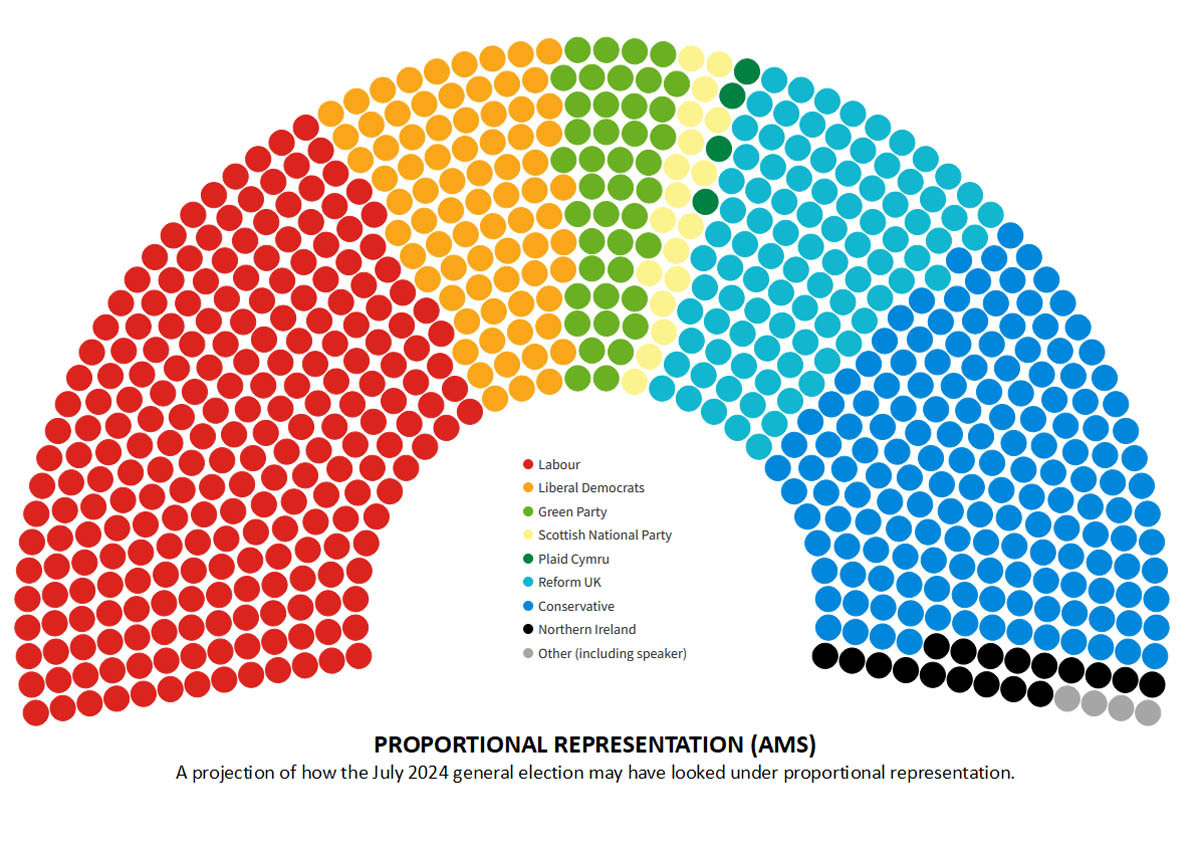
Graphics from the Electoral Reform Society.
Proportional representation
Proportional Representation (PR) is a principle, not a single electoral system. The principle, of course, is that the proportions of seats of the various parties in an assembly should match the proportions of votes for those parties, and so reflect the parties’ support in the electorate.
In fact, it is not generally possible to match these proportions exactly (largely because we cannot elect fractions of a candidate), but almost all practical electoral systems aim to achieve good proportionality except our own simple majoritarian system (FPTP) and the Alternative Vote (AV): which was the (non PR) method chosen for the 2011 referendum on changing the electoral system.
We consider here some of these PR systems and note that choosing between them will depend, not so much on the quality of the proportionality – all will be greatly better than FPTP – but on various other desirable features of an electoral system. These features, the desirability of which may be disputed and debated, include amongst others:
- avoidance of safe seats;
- removal of any need for tactical voting;
- a high probability of an elector’s vote helping elect someone (i.e. not being ‘wasted’);
- voters, rather than parties, being in control of who gets elected; and
- local representation and accountability of the representative to his or her electorate.
List systems
The system giving the purest form of PR, without consideration of any other factors, would be a national listsystem. In this case the nation’s votes for the various parties are counted and parties are allocated seats in proportion to their votes, counting down from the top of the list. The parties each have a list of candidates and if a party wins, say, 100 seats, it declares the top 100 of its list as its new MPs.
There are a number of weaknesses with this system. The most well-known is that a considerable number of small parties can all win seats, making an unstable legislature. This can be eased by setting a threshold that a party must reach before being allocated any seats. This also reduces the purity of the proportionality, though not seriously for the large parties.
Then there is the question of where to set this threshold – two per cent of the votes, three per cent, five per cent? The choice is rather arbitrary and there is considerable variation in practice. Another obvious failing is that those elected are not representative of any geographical part of the electorate, they are only representative of their parties. Examples of countries using this list system are Israel and the Netherlands.
Alternatively, the country could be divided up into smaller regions, with the PR system applied in each. This could reduce the degree of proportionality in each region, though this would be compensated by an averaging effect, when the results are added over the whole country.
Clearly if the regions, or constituencies, were very small, returning, say, five members, then maybe we could have two Conservatives (40 per cent of the seats) elected from 50 per cent of the vote, two Labour MPs from 35 per cent of the vote, and one Liberal Democrat or Green (20 per cent of the seats), from 15 per cent of the vote. This could be the best proportional result, but it is clearly not very accurately proportional.
Many countries use a form of regional lists of this kind. In general, larger regions will give better proportionality in each region, but smaller regions will mean more regions and a greater averaging effect.
Open or closed systems
List systems may be open or closed. In the case of closedlists, the voters only vote for parties, and not for specific candidates. The order of the candidates on the list (with those higher up having better chances of being elected) is set entirely by the party managers.
Withopen lists, the voters vote for individual candidates on the list. Only in the ‘most open’ case will the order of a party’s list be completely determined by its candidates’ votes. In many systems, only a small number of candidates with the highest number of individual votes will be promoted up the list, so quite a lot of the list is still the party’s, rather than the public’s, choice.
Nevertheless, an open list system is clearly better from the point of view of voter choice and voter control of who gets into Parliament. However, it is generally unrealistic for a country-wide constituency, as major parties, hoping to get, say, 200 seats, would put up at least 200 candidates, and voting would become totally unwieldy. The solution, as given above, would be to divide the country into regions (effectively large constituencies) of manageable size. In fact, the Netherlands does use a country-wide open list but this is for a relatively small legislature of 150 members, and the largest party lists may be as low as 30.
Although these systems are called ‘proportional’, the proportionality is always approximate to some degree, due to the requirement to return whole numbers of members – no fractions! For example, a party with 27.2 per cent of the vote, for a legislature (like ours in the UK) of 650 members, should get 176.8 members, so 177 MPs would be returned.
In a regional election for, say, 65 members, the exact result with this proportion of the vote would be 17.68 members, so the practical result should be 18 MPs. In fact, we cannot find the number of candidates for a party just by rounding the exact proportion to the nearest whole number. To take a possible example, if 12 candidates are to be elected in some region and the result of the voting gives six parties 4.4, 3.3, 2.3, 1.4, 0.4 and 0.2 candidates each, in strict proportion to the parties’ votes, rounding will give them four, three, two, one, zero and zero candidates respectively.
We see that only 10 candidates have been elected so far, so, to which parties should the other two be allocated? There are various methods in use for deciding how many candidates each party should have (with different good and bad points) and all giving good, but not perfect proportionality. Three such methods are D’Hondt, Sainte-Laguë and Hare. D’Hondt is the most common, and tends to favour the larger parties, with Hare giving more support to small parties.
Constituencies
One commonly attempted defence of FPTP is that PR breaks the British tradition of one MP representing, accountable to, and in principle working for, all his or her electors – the MP is more than just a party cipher. This criticism is valid for the list systems described. However, there are two systems that are most likely to be seriously considered for electoral reform in the UK, which indeed retain a constituency link, albeit with larger constituencies. These are Additional Member System (AMS) and Single Transferable Vote (STV).
AMS is a hybrid FPTP/list system, keeping a constituency form, but generally achieving good proportionality. A fraction (e.g. 60 per cent) of the MPs are elected by simple majority in single member constituencies (i.e. by FPTP) which will be larger than the current constituencies. The other 40 per cent of MPs are elected through a list system. Voters have two votes – one for their constituency candidate and one for a party (not necessarily that of the candidate).
After the constituency results are known, with whatever disproportional result, MPs are taken from the party lists to achieve an overall proportional result, the party proportions being based on the list votes. These added MPs are termed ‘top-up’ MPs. Forms of AMS are used for the Scottish Parliament and also in Germany and New Zealand. It could be implemented in the UK without disrupting current UK arrangements greatly. However, it has some snags and disadvantages.
Using FPTP in the constituencies means accepting its many flaws – safe seats, tactical voting, candidates elected with a minority of the votes and low vote utilisation. Another problem, ‘overhang’, arises when the FPTP result is such that a party wins more seats in the constituencies than its correct share (so its ‘top-up’ should be negative) and this can reduce the proportionality. The system used in Scotland uses regional closed lists with D’Hondt counting: taking into account the seats won in the constituencies. Overhang can degrade the proportionality to some degree, though still greatly improved on FPTP.
Two other qualifications should be noted; first that there are two types of MP – constituency and top-up. Do top-up MPs do any constituency work? Are they allocated to a constituency? If so, how? Second, attempts have been made to ‘game’ the system by splitting a single political movement into two parties, with one aiming to gain excess seats in the constituencies and the other via the party list vote, to obtain more seats than the single party on its own.
STVin multi-member constituencies is also constituency based but is very different from both FPTP and list methods. Preferential voting is used, which means that a voter labels the candidates in order of preference, knowing that his or her vote can be transferred, if necessary, rather than be wasted. There are two cases during the counting where this may occur.
The first is when a candidate receives more votes than needed for election, in which case the excess votes are transferred to the next lower preference on each ballot paper, and the second is when a candidate is eliminated through lack of support, and his or her votes are transferred similarly. The system is often criticised as being complex, but the complexity is only in the counting – it is easily understood by the voter. When STV for local elections was introduced at the same time as AMS for the Scottish Parliament, there were far more errors in voting using AMS than STV.
It is not immediately obvious that this system is indeed proportional. In fact, it produces an essentially proportional result in each constituency and (as for the regional list system, above) when averaged over a number of constituencies gives a good result. A parliamentary report in 2008, reviewing electoral systems in use in the UK, concluded “only STV in Northern Ireland has achieved . . . close to genuine proportionality”.
STV seems not to be widely known about, which may account for its low use internationally. It has long been used in the Republic of Ireland and twice the electorate, invited to change via a referendum, has refused (in 1959 and 1968), indicating a clear endorsement of the system. It is also used for Assembly elections in Northern Ireland and local elections in Scotland, and is now (2024) offered as an option for local elections in Wales.
Many electoral reformers favour this system, which scores highly on most of the desirable features of an electoral system – good proportionality, high vote utilisation, no safe seats or need for tactical voting, high degree of choice for the voter, and a choice of MPs for constituents to take their problems to, for example.
In conclusion, there is a considerable number of systems that can be described as PR systems, all of which give good proportionality, but none is perfect. Proportionality is highly important, but is not the only requirement of an electoral system.
In fact, proponents of FPTP often place local representation more highly, along with the dubious claim of giving more stable government. However, there are many faults with FPTP, in addition to disproportionality, caused by the use of single member constituencies. When the question of replacing FPTP by a proportional system arises, the decision must be based on due consideration of these other features as much as on proportionality.